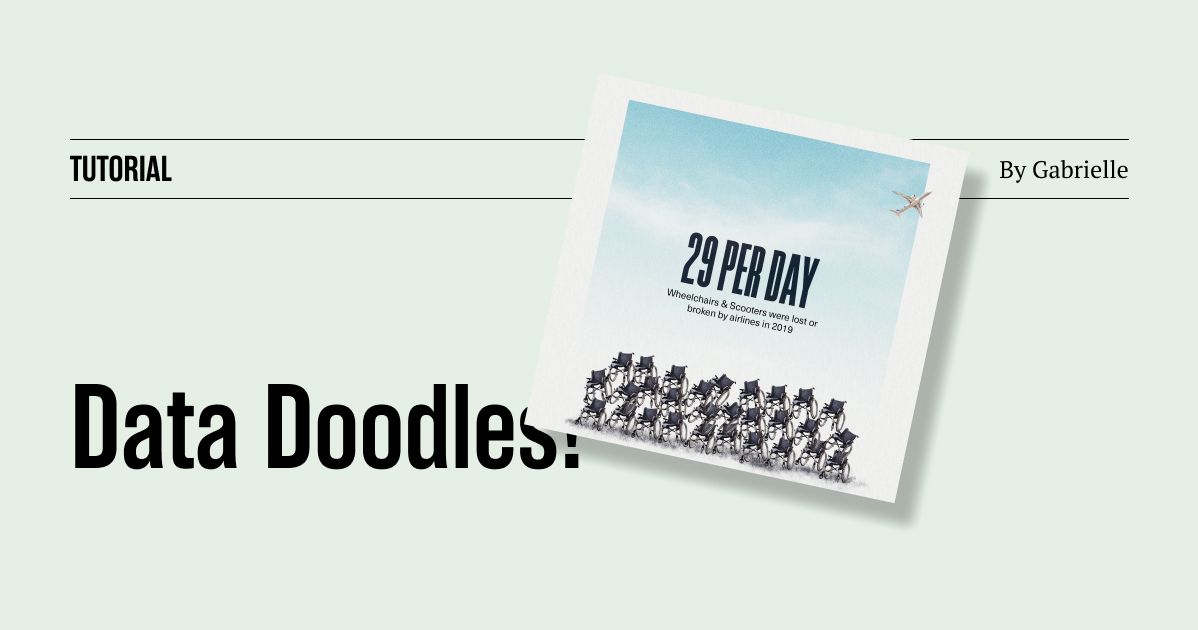
Data Doodles - Ep 01

📈
This article was created for members of the Elevate Dataviz Learning Community. We're making it available for free as part of our effort to boost data storytelling among the public. If you'd like to grow your dataviz skills as part of a supportive community, then consider joining our group.
This is the official first episode of the series Data Doodles or "How to make an illustrated dataviz". You'll be able to follow along the process behind most of the personal visualizations I post on social media. From A-to-Z. No cut. Adobe, Excel, and myself.
First episode is the Behind-the-Scenes of a recent data visualization on airlines and accessibility.
Do you like this format? Would you like to see less? More?
