Our Favorite Dataviz Tools
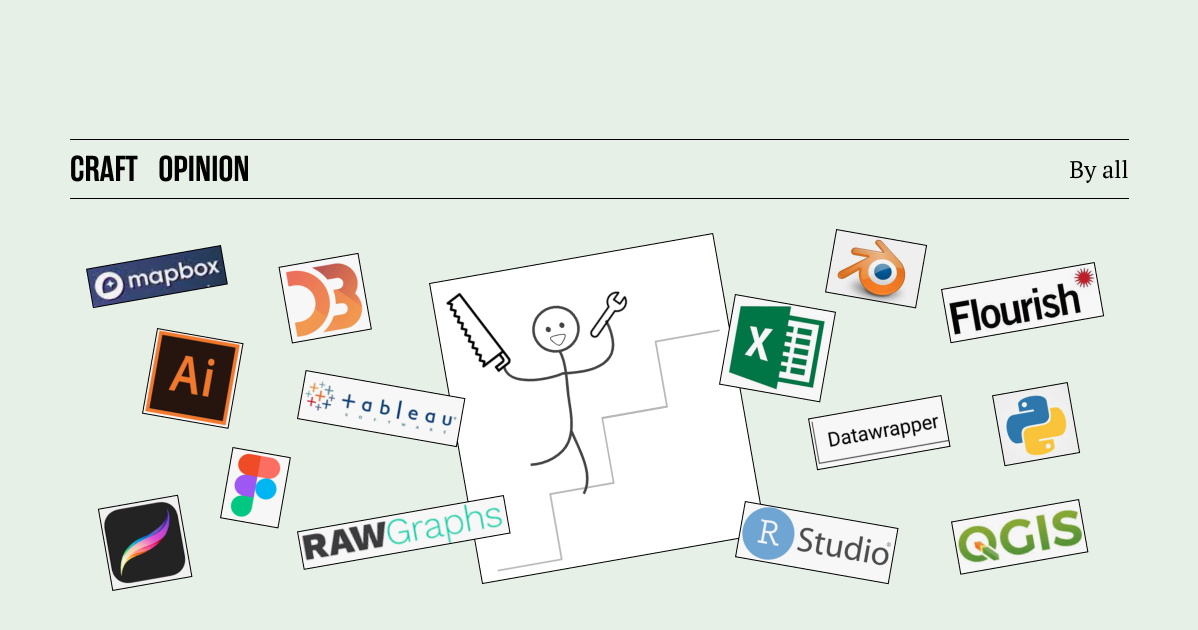
Tools are important. Tools are where we spend almost all of our time, and good tools make that time far more enjoyable. Over the years, we've tried out a lot of different tools, and come up with a toolkit that works for us. Does this introduction use the word "tools" too much? Yes. Yes it does. But if you're in search of a new tool to try out then you'll definitely find something useful below.
What are your essential tools that you use on every job?
Gabrielle
I mainly use a combination of Excel, Illustrator and Photoshop. For editorial work, and my freelance work I also use InDesign, Keynote (and sometimes PPT!). For webdesign & UX/UI, I use Figma (and I love it!). Because I work with a lot of images, I also often have Lightroom open.
From time to time, I take advantage of the template graphs from RawGraph.
On the hardware side of things, I have a iPad tablet that I love using to sketch or creating hand drawn illustrations and textures. I also have a Huion 1060P tablet to digital paint on Photoshop.
Will
Frequently used
- R/Rstudio for data wrangling and analysis
- Google sheets and google docs for collecting data and writing copy
- Pen and paper for sketching ideas and taking notes
- Figma for wireframing and all things design
- Datawrapper for making simple charts
- Code! I write my code in VScode and use some combination of HTML, JavaScript, CSS, D3, and Svelte on any web project
Less frequently used but still important tools include: Photoshop, Adobe Illustrator, Blender, FFmpeg, Mapbox, and QGIS.
Duncan
The trifecta for me are Google Sheets, Flourish and Figma. I use Google Sheets for loading my data, inspecting it, fixing problems, and performing analysis. I use Flourish to plot the data into a chart because it supports about 90% of the chart types that I need. Then finally I export an SVG into Figma for design clean-up, artworking, annotation, and anything else.
If I have a huge dataset that Sheets can't cope with, I'll use Python and the Pandas library to boil it down to something I can work with. If I have geodata then I'll use Mapshaper (see below). For digital sketching I use my iPad with Pencil and the Procreate app. For physical sketching, I love my Leuchturm Master dotted A4 notebook, my 2.5mm Copic Multiliner SP and my Pigma Micron fibre-tips for colour. For sonification work I use Sonic Pi and Logic Pro. And it's always fun to do creative work with p5.js.
Alli
My go-to toolbox is filled with Excel, Tableau, and Adobe Illustrator. I can do so much in Tableau and then save it as a PDF and open it in Illustrator to edit the vector elements.
I also use RawGraphs to create the bones of a chart and bring it into Illustrator or Figma to clean it up (what does "clean it up" in Illustrator mean?).
Occasionally I'll use Datawrapper or Flourish depending on the client and their needs. I find these to be really flexible without having too many options, and they also embed into a website a lot sleeker than Tableau, in my opinion.
I've begun to use Adobe After Effects to animate the charts that I create in Illustrator. And when I create an illustration or pattern, I use Procreate for iPad.
What's an underrated tool that more people should know about?
Gabrielle
Not underrated but disregarded in the data visualization field: Photoshop and Figma Prototype function.
Photoshop is the most complete tool I know when it comes to adding textures, cropping photos, creating effects. There are so many functions and it can really lift a visual from good to amazing!
Figma includes a prototype function that I haven't seen mainly people using. If used properly, it can really give life to the design of an interactive data visualization, web design projects, and some small animations. It also makes it easier to communicate concepts when working with web designers.
Will
Blender is a tool for 3D modeling, rendering, and animation. I've only just begun to explore this tool, but I can already tell that it's majorly underused in dataviz. I think 3D visualization in general is really undervalued and we'll see more and more of it in the coming years.
The interface for Blender is a bit clunky and there's a steep learning curve, but it's an incredibly powerful software, and best of all, it's free!
Duncan
I love and cherish Mapshaper, a super-fast, browser-based geodata editor. I use it for seeing what's in a geodata file, small editing tasks, joining shapefiles with CSVs, performing analysis tasks like filtering and cleaning, converting between different formats, and even basic design and visualization tasks (it exports to SVG!).
It's pretty bare-bones, and you'll need to spend a bit of time with the wiki to understand its true capabilities, but it manages to combine simplicity and power in a way that leave the bloated alternatives (looking at you, QGIS) in the dust. If you want to get started, there's a good tutorial from Hands-On Data Visualization that you can run through in less than an hour.
Alli
I really get excited to show people the power of Procreate! You can use it on your iPad or iPhone. I use it to sketch ideas, brainstorm with clients (you can download zoom on your iPad and share your iPad screen very easily), create animations, and design any icons or illustrations to go along with your graphics.
The more you communicate with data, the more you realize how much there is beyond the typical chart. You can communicate information with diagrams, illustrations, comics, shapes, text over images, etc.
When you can draw these things yourself (it doesn't need to be super fancy or polished), you open up a whole world of possibilities! Here are my favorite Skillshare classes to get started with Procreate:
- Great outline of the basics: https://skl.sh/2J0W6aE
- Animation! https://skl.sh/3pbi2iZ
- More workflow-related: https://skl.sh/3oXosSC
What tool should exist but doesn't?
Gabrielle
An easy software to create animated designs easily. Adobe After Effects gives me headaches. Can we talk about how Excel feels very '95 too?
Will
A video editing software that's both simple and easy to use, but has enough options and power behind the scenes. Video is such a powerful tool for storytelling, but every video editor I've used is either far too simple to really get the job done (iMovie), or far too complex with too steep a learning curve. Nothing has hit that sweet spot yet.
Duncan
I really miss a good, fast CSV editor, where I can check out the contents of a CSV file, do some basic filtering and summarising and export, clean up data by editing the contents of individual cells, and then export in different formats. Like Mapshaper but for CSV, really. Tad goes some of the way with viewing and filtering, but it hasn't been updated in three years and doesn't allow for editing individual cells.
Alli
I'd love a really intuitive tool that helps you translate encodings into data visualization. I feel like Data Illustrator and Charticulator are trying to be that tool, but they're not user-friendly. I kept trying to use them, but I couldn't wrap my head around them. I just want to be able to say, "here's a diamond, now I need the diamonds to be sized by this variable, colored by this variable, with a radial Y-axis." I keep thinking a good solution would be a plug-in with Procreate where you could draw certain elements and then choose to encode its attributes with data. This kind of tool would really open up these "bespoke" visualizations to more people.