Do I need to learn D3?
This post comes from a question Max asked on Slack:
In your article “How a major newsroom publishes graphics” you mention that you use Datawrapper 80% of the time. I’ve been trying to become confident in D3 this past year, but I also notice its use case is becoming more and more reduced due to these plug & play interfaces (Datawrapper, Flourish, Tableau). While I am more interested in making interactive visualizations, do you think it is worth the immense time and energy considering how little it is used? It seems like The Pudding might use it for the majority of their work (maybe the Kontientalist too), but beyond that I am not sure!
I thought it was such a great question (and one that many of you have probably wondered) that it warranted a blog post. But to answer this question, we first need to understand two things: 1) What is D3? and 2) How did we get here?
What is D3?
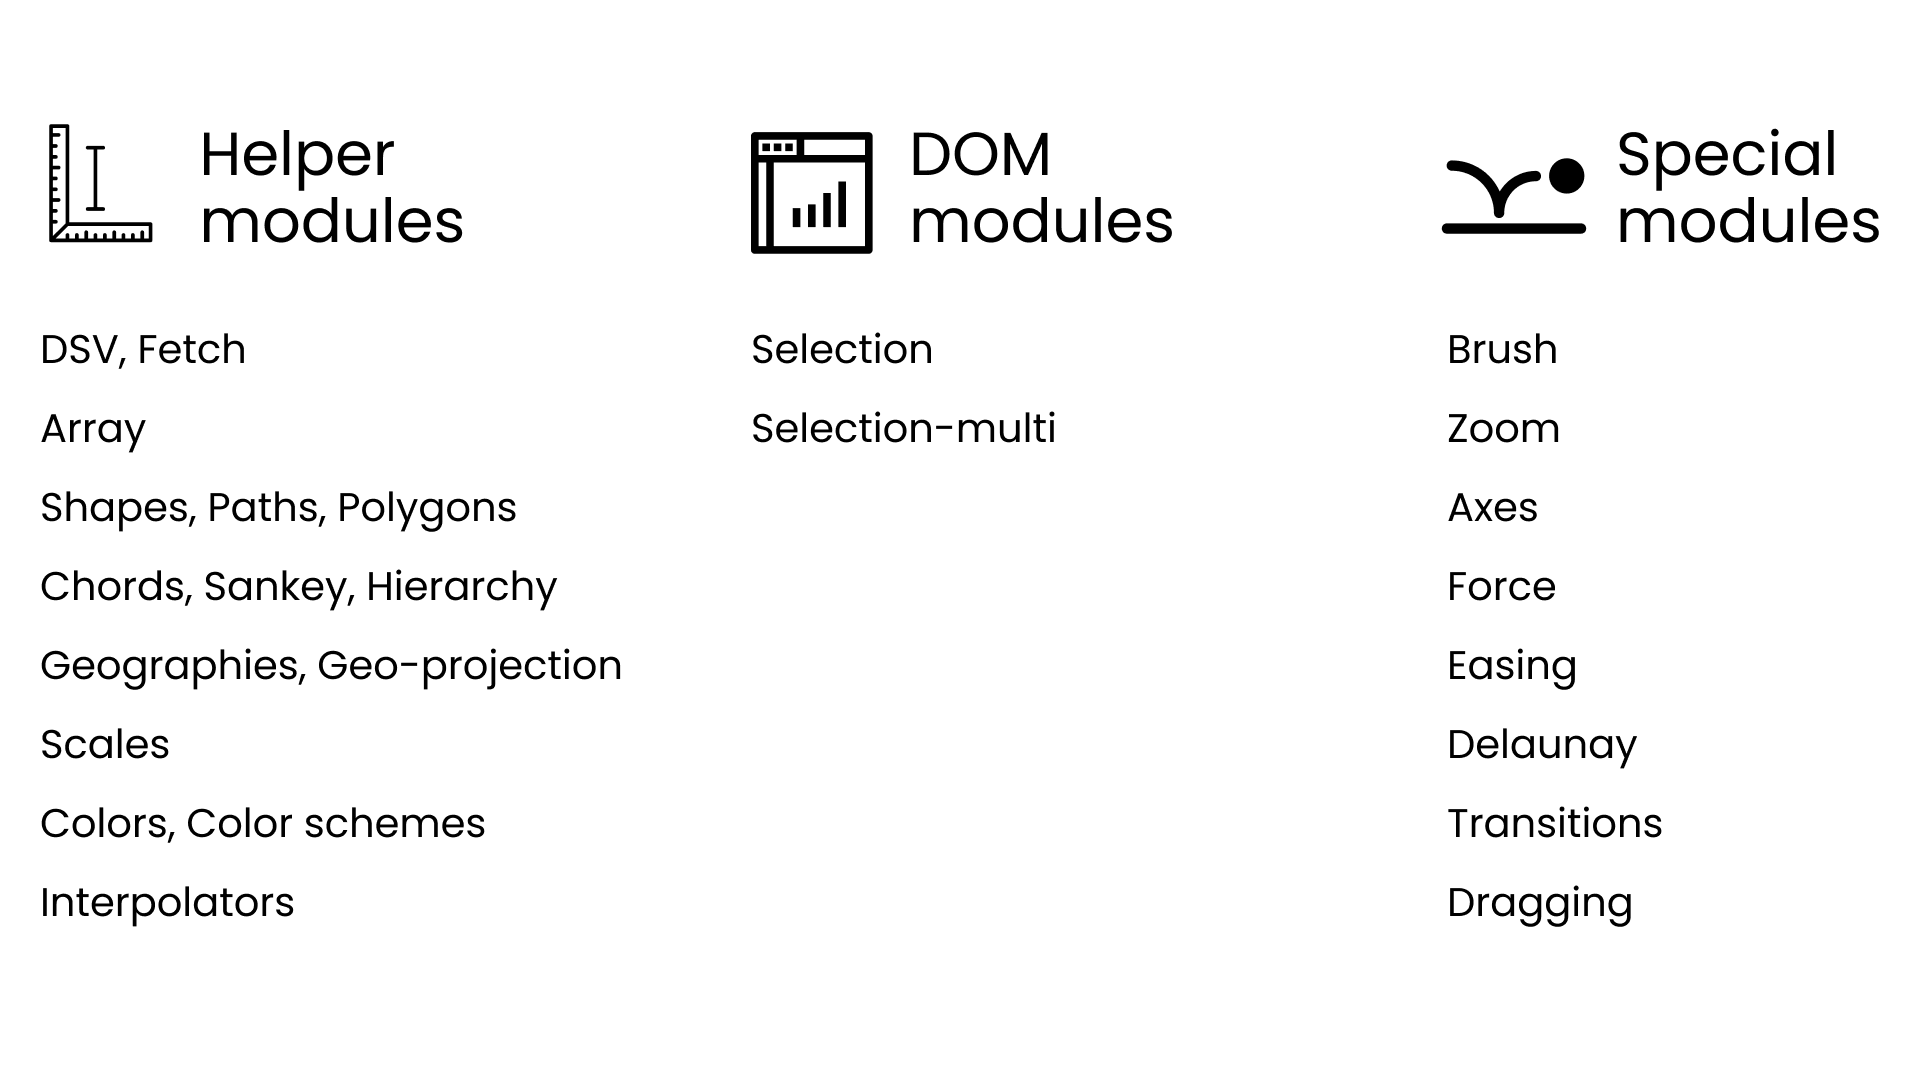
D3 is a JavaScript library that is often used to help people make interactive data visualization for the web. But D3 does not include functions like `barChart()` for directly making charts–instead, it provides low-level functions that help you to compose custom graphics. These functions are grouped into modules, each of which helps with a particular part of the graphics process, such as scales, axes, or interaction. I place these modules into three groups:
- Helper modules like scales and shapes, which contain functions for transforming your data from numbers into pixel values. This group also includes modules that help with data formatting, colors, and maps.
- DOM-manipulation modules that allows you to do things like looping through rows of data and adding an SVG rectangle to the DOM for each row. This is where you find the famous enter-update-exit pattern in D3.
- Specialized modules that help with animation, interaction, force-directed diagrams, and more. These are more obscure functions that won’t be used as often.
Understanding the structure of D3 is important because as we’ll soon see, the real question should not be “Do I need to learn D3?” but rather “How much D3 do I need to learn?”
How did we get here?
Back in 2012-2015, D3 was really the only way to build custom interactive graphics for the web. It loomed particularly large in journalism, and it is because of this dominance during an era when digital news was exploding that D3 now occupies such a large place in the data visualization community. But as web development and data visualization grew, the tools matured along with it. Nowadays we have two additional toolsets that have reduced the importance of D3.
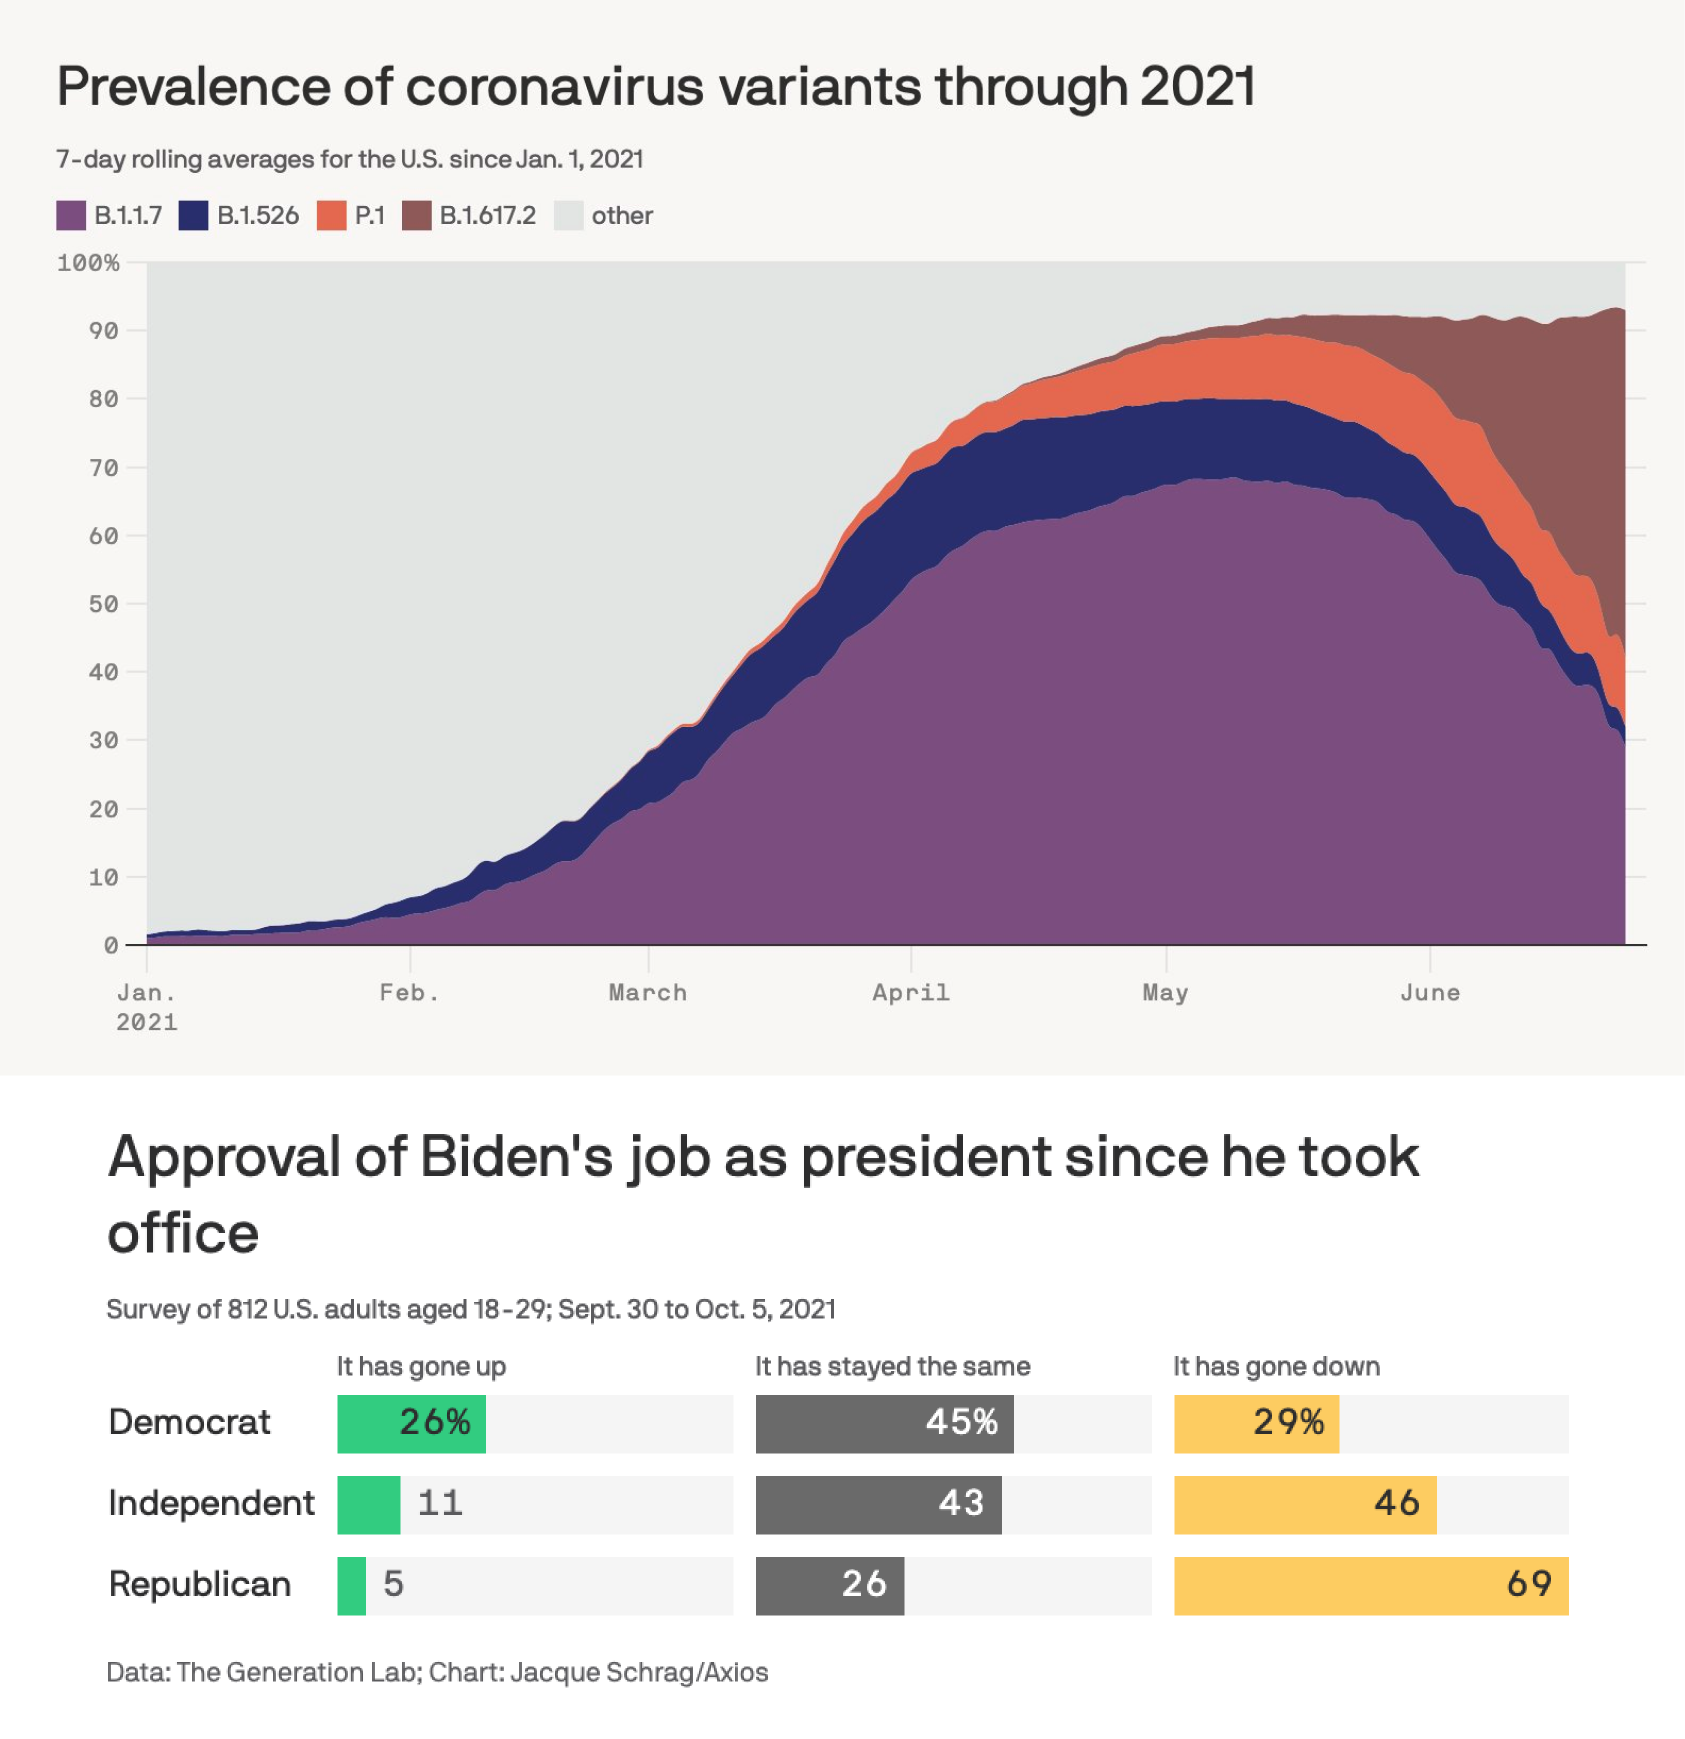
- No-code tools like Flourish and Datawrapper have made it possible to produce a range of interactive charts with ease. They still lack the full customization that comes with code, but the truth is that they can cover a majority of needs for standard newsroom charts.
- JavaScript frameworks like React, Vue, and Svelte allow easy control and rendering of the DOM, which removes one of the main functions of D3.
How much D3 do you need to learn?
Well, it all depends on what you want to do.
You don’t need to learn any D3 if...
- You want to focus on design and static visualizations
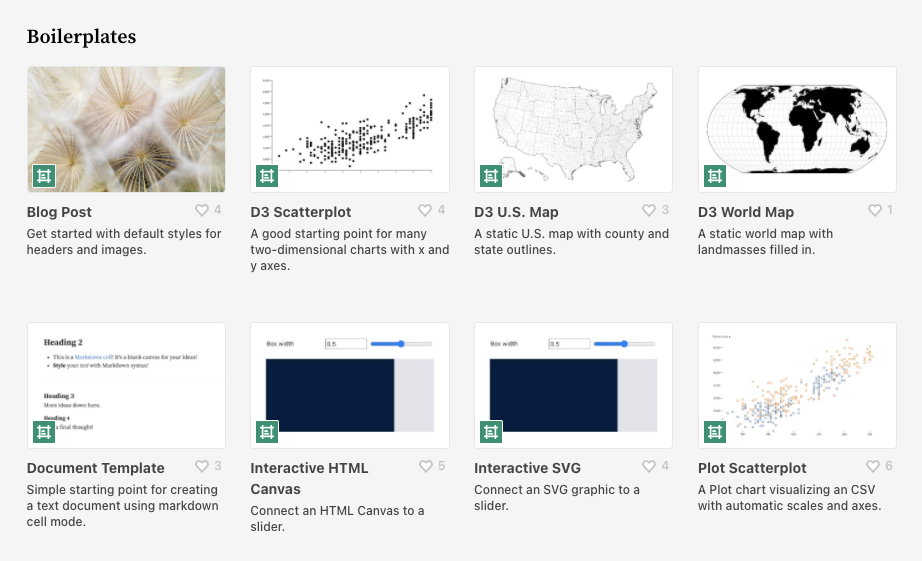
- You want to focus on more standard charts like bars, lines, tables, simple maps, etc. In this case, Flourish, Datawrapper, ggplot, and Illustrator can cover your needs
You need to learn a bit of D3 if...
- You want to be a jack-of-all-trades. I would recommend learning enough to dabble in D3, focusing primarily on things like scales and shapes, and how to read and adapt other people’s code
You need to learn a decent amount of D3 if...
- You want to build interactive articles with more custom visualizations, think Pudding-style pieces that involve custom charts, scrollytelling, and animation
- You want to be a full-on visualization engineer, either working for a company or as a freelancer. If your sales pitch is “I can build whatever you dream” then you should know D3 well
All of these options are perfectly viable for working in data journalism or as a data visualization freelancer. And ultimately, unless you want to target jobs that are engineering-focused, learning D3 should happen naturally, only as you need it.
Although I love D3, and do think it's a valuable skill, I wouldn't place a high priority on it for a new learner. If you’re just starting out in data visualization development, it’s far more important that you develop a solid understanding of web development fundamentals (HTML, CSS, JavaScript), and add in D3 only once you are comfortable and feel that you need it.