Community Portrait: Razvan
At Elevate, we want to celebrate our community members and allow you to get to know them more. This week we're meeting with Razvan Zamfira, Information Designer and Founder of Interrobang from Bucharest.
Hi Razvan, who are you and what do you do?
As a former architect and geographer, my passion for data visualization began as a means to convey urban research and phenomena. Through my work with participatory urban planning charities, I discovered the power of data visualization in communicating complex information to a broader audience. Though I have since moved away from architecture and urban planning, I remain drawn to urban data projects.
Currently, I split my time between a long-term collaboration with the Global Resilient Cities Network, an organization dedicated to promoting urban resilience, and my own data visualization design studio, Interrobang. Through my studio, I primarily work with local and international NGOs to develop data communication campaigns.
Outside of work, I'm a coffee aficionado and an enthusiastic student of functional ceramics, exploring the potential of this medium to create physical data visualizations.
How did you get started in dataviz?
I began my journey with data visualization during my bachelor's studies in architecture. Although I attended a very traditional architecture school where the final shape of a design was of utmost importance, I was more interested in the analytical aspect of the work. I enjoyed contextualizing the characteristics of the object based on its surrounding area and the needs of its future users. This led me to experiment extensively with statistical analysis and 3D simulation programs to study energy efficiency, orientation, connection between spaces, and even a bit of parametric design. In retrospect, I should have been proud of my different approach to design rather than feeling like an outsider compared to my colleagues.
It was only after enrolling in another master's program in urban studies that I realized I could turn my passion for data visualization into an actual profession. During a class in Vienna, I learned how to combine art with scientific research to explain various facts about the demographic structure of the city.
After completing my studies, I went through the classic confusion of what to do next and how to start an actual career. I was already working for an NGO dealing with public participation in urban planning in Bucharest, but this didn't seem to be going anywhere on the long term. I also did some graphic design work on the side to supplement my income, but I felt uneasy about abandoning my research-oriented work to focus solely on graphic design. It took me nearly a year to piece everything together, but when I finally realized that data visualization was the answer, and that it combined everything I had done up to that point, I quit my NGO job and stopped taking general graphic design commissions. It was 2018, and I have been working in data visualization for five years now.
I have no regrets about that decision whatsoever. I only wish I had made it earlier, and that choosing one path over another was always that obvious.
Is there certain type of data visualizations that bring you joy?
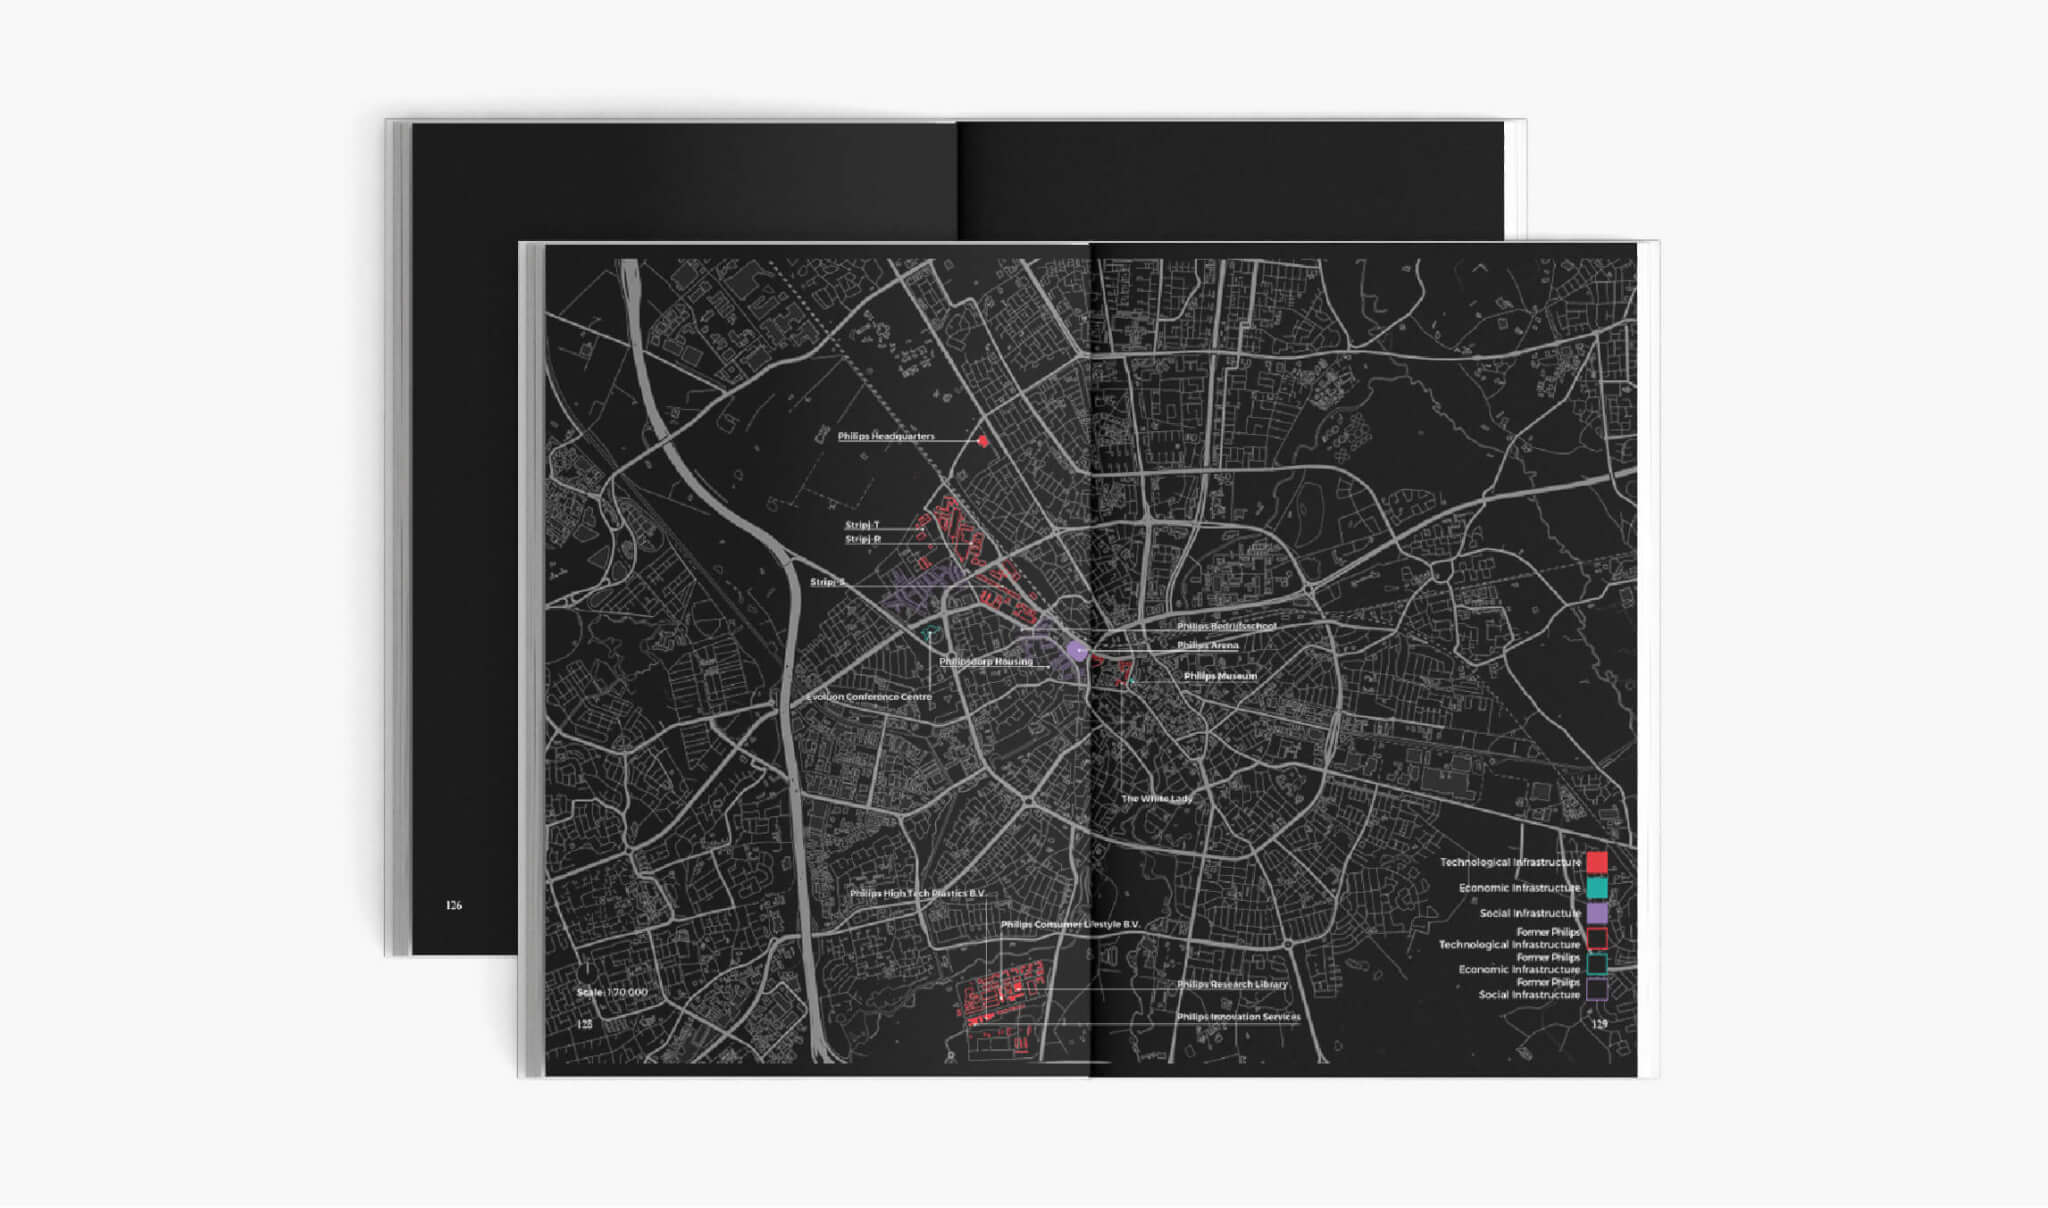
As a data visualization enthusiast, I am always eager to explore new forms of communicating data. Maps used to be my go-to medium, but I have not had the opportunity to work with them as much as I would like.
Recently, I have discovered the potential of ceramics as a medium for data visualization. The three-dimensional quality of ceramic objects offers a new dimension to explore in creating innovative chart types. Unlike virtual 3D data visualizations, ceramics allow for a more natural interaction and provide a tangible, physical connection with the data. The added benefit of being able to interact with these objects through touch makes for a more immersive data communication experience.
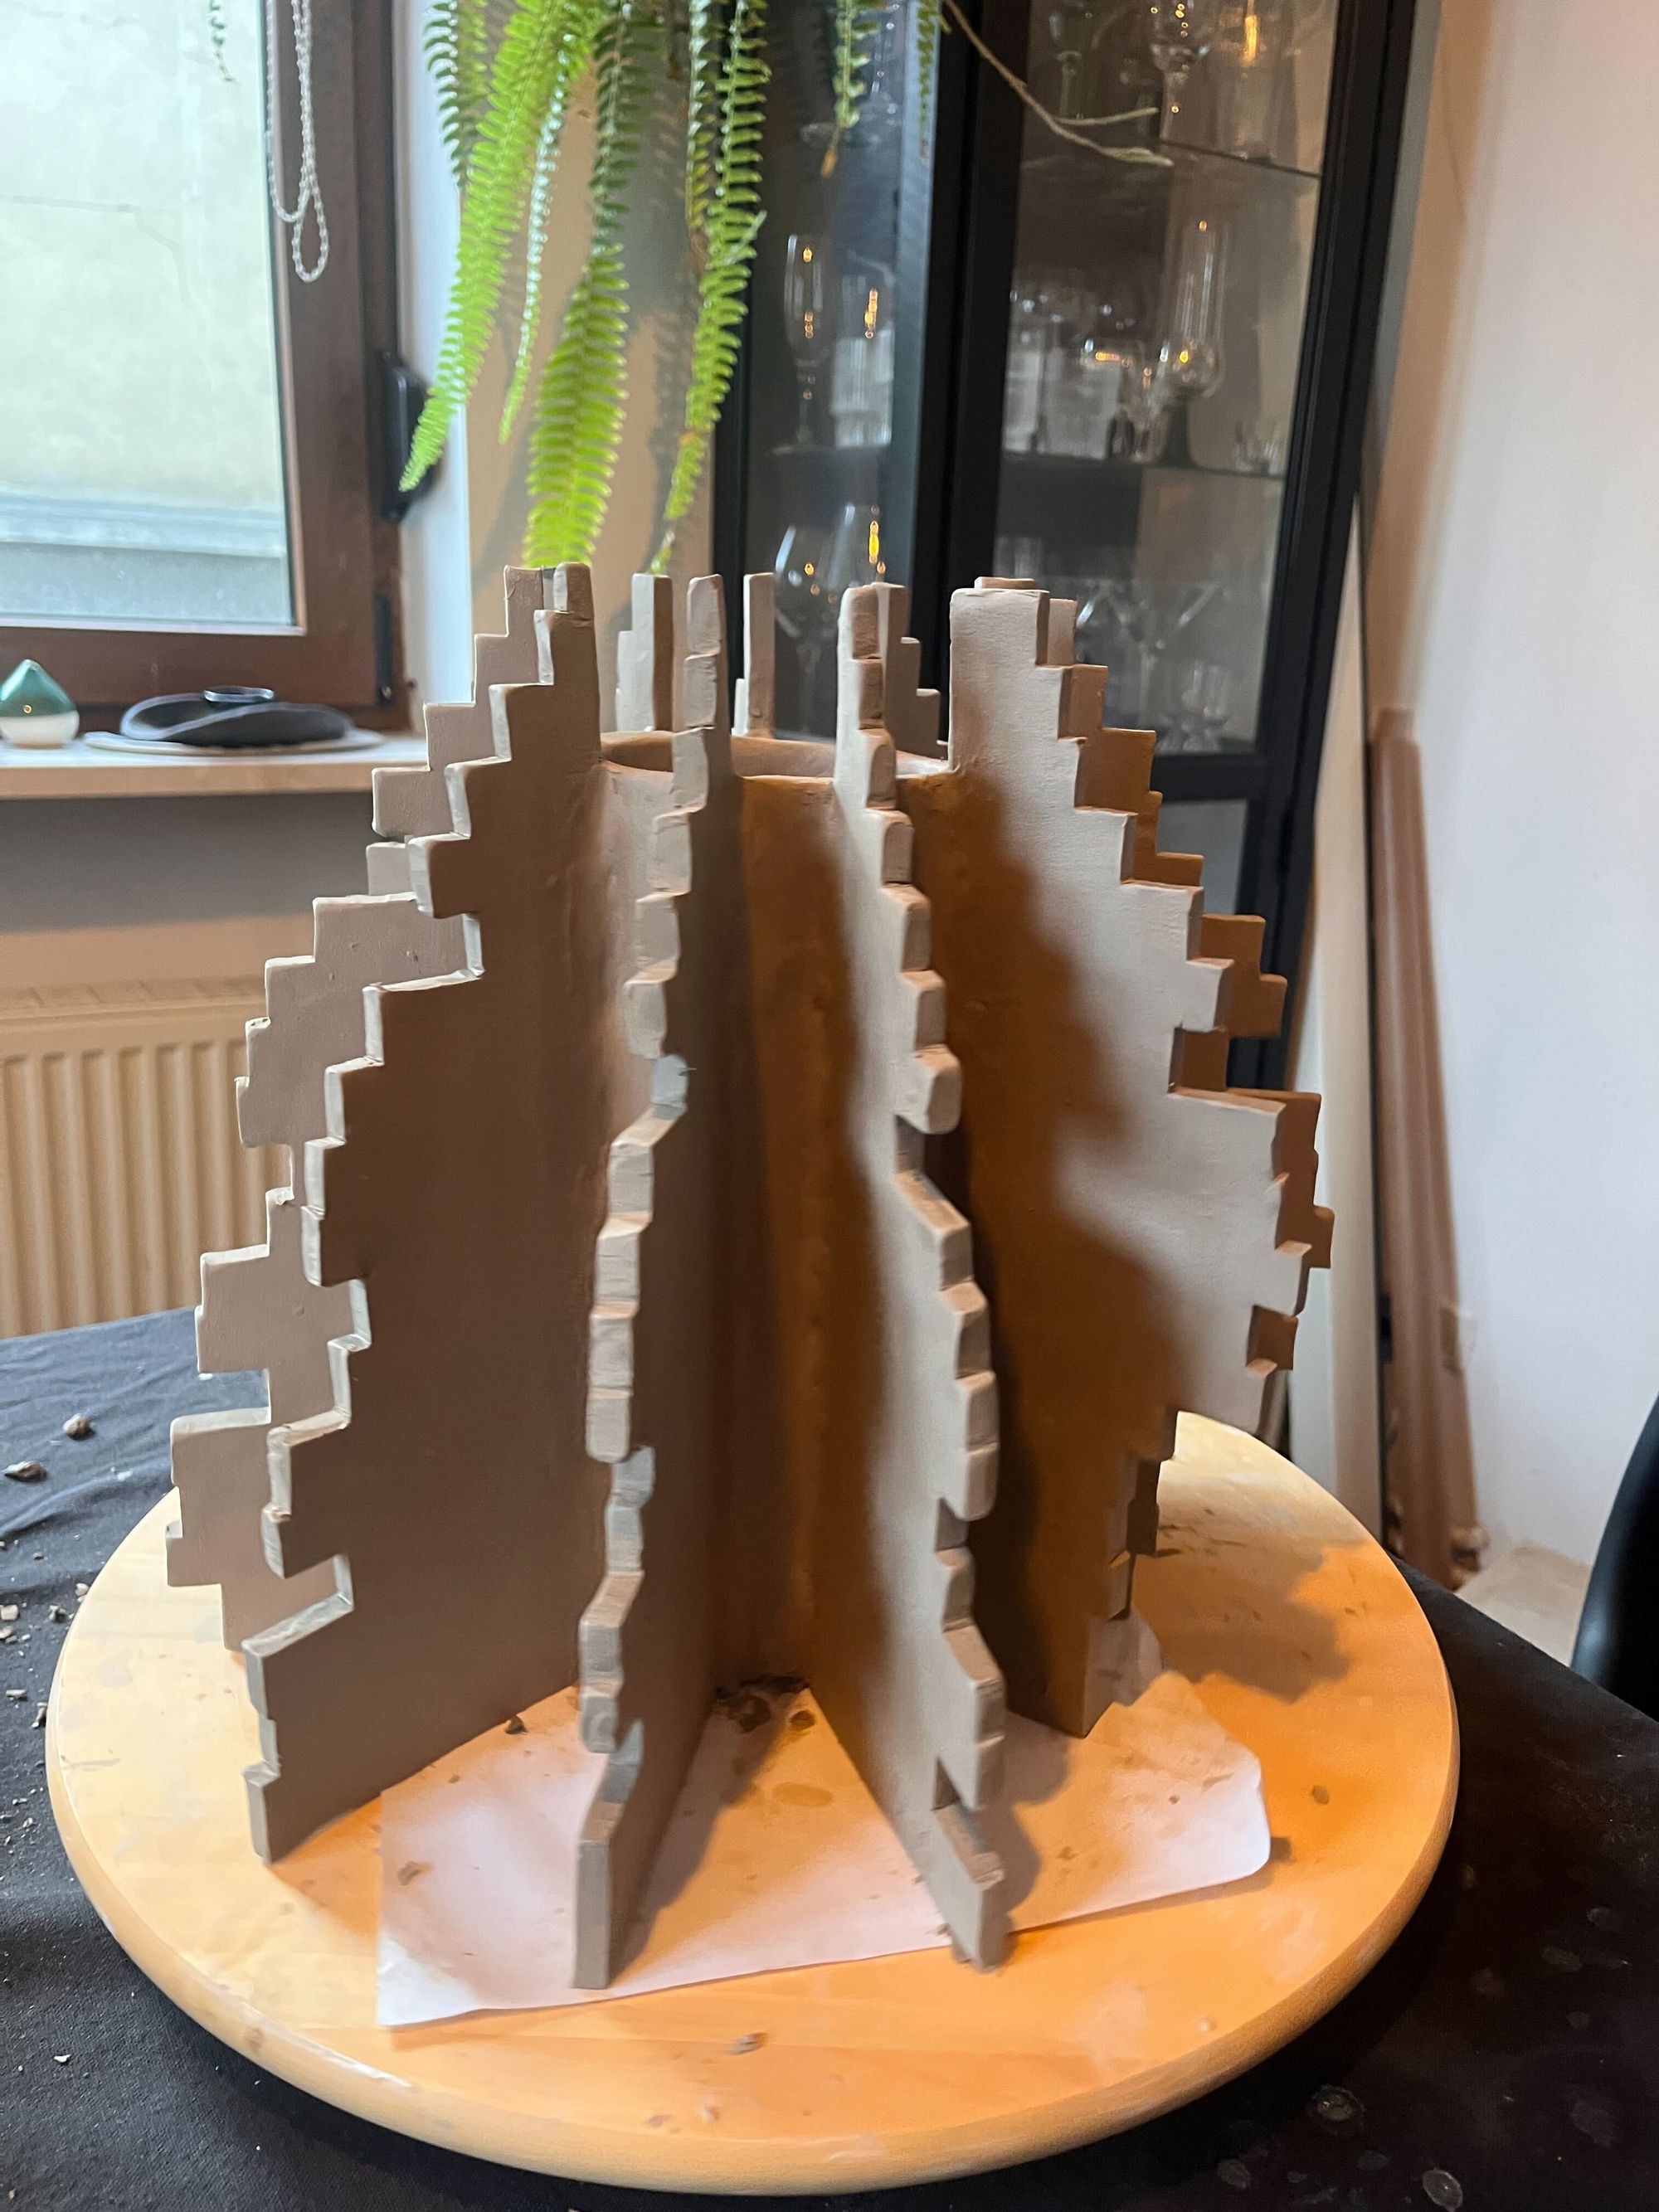
The possibilities for encoding data in ceramics are very broad, including texture, weight, reflection, shape, color, as well as other visual cues borrowed from digital 2D data visualization. While the idea of using ceramics for data visualization may conjure up images of abstract art sculptures, I find functional ceramics to be more appealing. By creating objects such as plates, vases, cups, or lamps, that people can use in their daily lives, we can increase the interaction with the data itself. Imagine eating from a plate shaped by data and how it could constantly remind you of the information it represents.
What are your biggest challenges when it comes to the world data visualization?
I believe that, like many other data visualisation practitioners, I face common challenges in my work. For instance, I encounter difficulties in maintaining engagement with clients during the design process, and in convincing them to view data visualisation as a long-term process rather than a project-based one. In addition, it can be tough to monitor the actual impact my work has, and to scale my practice.
Currently, my biggest concern lies in the last two issues. Prior to working with clients, I found it easy to assess the impact of my work because I was also the commissioner. However, back then, I wasn't reaching a wide enough audience, so my conclusions were somewhat anecdotal. Now, I feel a bit disconnected because I go through my design process, which includes user testing to some extent, but I rarely get to know about the long-term impact of my designs on organizations and their audiences. The last five years have been a constant battle, first to get my studio up and running and to convince people who weren't used to communicating with data to give visualization a chance. Then, to manage a healthy work-life balance and to decide which projects to pursue, given the lack of a 48-hour day. I find it challenging to turn down projects because I always feel humbled by the consideration of those who want to work with me. This has led me to consider expanding my practice, but I always feel too time-pressured to ask for help.
You shared with us that your favorite project so far was your Food Journal piece, that you created with four friends. Could you tell us more about why you decided to work on a collaborative piece?
I’ve always had a love hate relationship with my designs; it's in my nature to be a bit of a perfectionist which contrary to general understanding is quite unhealthy. This is why after completing a project, I often feel a bit underwhelmed that it wasn't as bold as I envisioned it or that I didn't have enough time to delve deeper into the subject matter.
I’ve always had a love hate relationship with my designs; it's in my nature to be a bit of a perfectionist which contrary to general understanding is quite unhealthy.
Nonetheless, I find myself revisiting past projects frequently, whether it be for a client pitch or simply to update my portfolio, and it's during these times that I realize their true value. In the end, it becomes challenging to choose “a favourite project” over another as I start to realise most have a particular part of the process that excelled and deserves recognition.
However, the Food Journal project stood out to me because it was a personal undertaking and the first time I could actually show my friends what I do.
But before we dive into the project, let me give you a bit of background information. This project started at the beginning of the COVID-19 pandemic as a collaborative food journal between myself, my partner, and two other friend couples. During the lockdown, cooking and eating were some of the few enjoyable indoor activities we had access to, and I was easily able to convince everyone to document their diets.
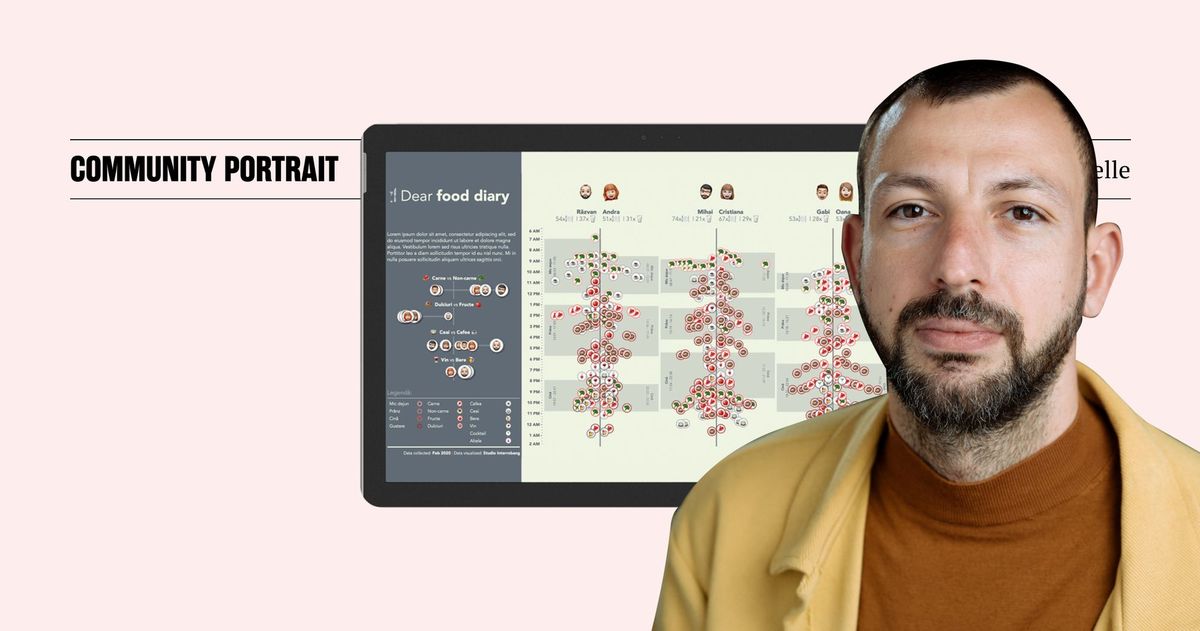
At its core, it visualized our food patterns over ten days. But it is as much about the data visualization output as it is about the process behind its collection and how important participation was to foster curiosity about the final output. We wanted an easy way to collect the data. This is why we crated an Apple Shared Album where everyone posted a picture of everything they ate or drank during each day at the time it happened. This rapidly became a proto-version of the BeReal app, and everyone eagerly awaited one another's posts and comments. The entire process was so engaging that it was very hard to stop after just ten days.
After collecting the data, I got to work coding it. I noted the time of each post, the person, and categories regarding its contents, such as if it was food or a drink, and what kind of food or drink it was. I wanted to turn this into an interactive chart as well as a poster. The most significant finding from the research was how different our meal times were. One person’s breakfast was another's lunch. This combined with the fact that I wanted to show the data at different levels of granularity on as few charts as possible made me chose to create a packed bubble chart timeline for the main chart, where the Y-axis for each person would represent the time of day, and on this line, each bubble would code the type of meal/drink and its contents.
I also experimented with how to build the chart key. Rather than merely explaining what each icon represented, I created tops for each section. For example, instead of saying that the broccoli emoji meant a vegetarian dish, I plotted how vegetarian each of us was and declared a winner for each section. I believe this helped my friends connect with the content and understand how to read it more efficiently.
Ultimately, the Food Journal project won my heart because it proved that data collection can be an extremely enjoyable process that could also foster collaboration in later project stages.
It was also one of the few times that I felt like I was building something as part of a highly engaged team. By involving everyone from the beginning they became very interested in the final project and constantly participated with ideas about what to analyse. Last but not least, it was an engaging way of exploring new data visualization techniques, something that would sometimes be challenging to do as part of a commissioned project.
You’ve been engaging a lot with the community and the program as a whole, do you have a recommendation for others on how to take advantage of Elevate?
I have to start by expressing my gratitude to the Elevate community for helping me progress in my career. Before joining Elevate I was part of the Data Visualization Society Slack community for a few years but for some reason I always found it overwhelming to post there and connect with my peers. Despite the inspiring ideas and projects, the community felt too large for me to follow up on conversations and truly engage with others.
However, I knew that I needed to start interacting with other professionals in the field, as working in data visualization in Romania can be quite lonely. One evening, while exploring Data Visualization Society’s Buddy initiative, I decided to reach out to a couple of people living in Europe, with the hope of working with them to improve our data visualization skills or just a bit of small chat. This is how I connected with Duncan, whom I knew from other online events. We had a friendly exchange, and this made me realize that I could do this more often by joining the Elevate community and connect with a smaller, yet more closely-knit group of people.
Since then, I have been fortunate to get to know a few of the growing number of members. I’ve followed up on a few of the challenges and tried to participate in as many conversations I have an opinion about.
Although I don't dedicate nearly enough time to the community, I have found it to be an incredibly useful place for both finding the latest info about data viz resources as well as for celebrating and venting about the frustrations of the job.
The most important thing for me has been not feeling alone in this, and I truly appreciate the effort that everyone puts into this community project. To you Alli, Gaby, Duncan and Will as well to all the other members, thank you for creating a supportive and engaging community for data visualization professionals like myself.
- Check out his portfolio with all his projects
- follow him on Twitter and Linkedin.