Community Portrait: Max Graze
At Elevate, we want to celebrate our community members and allow you to get to know them more. This week we're meeting with Maxene ('Max') Graze.
Hi Max! Could you tell us about who you are and what you do?
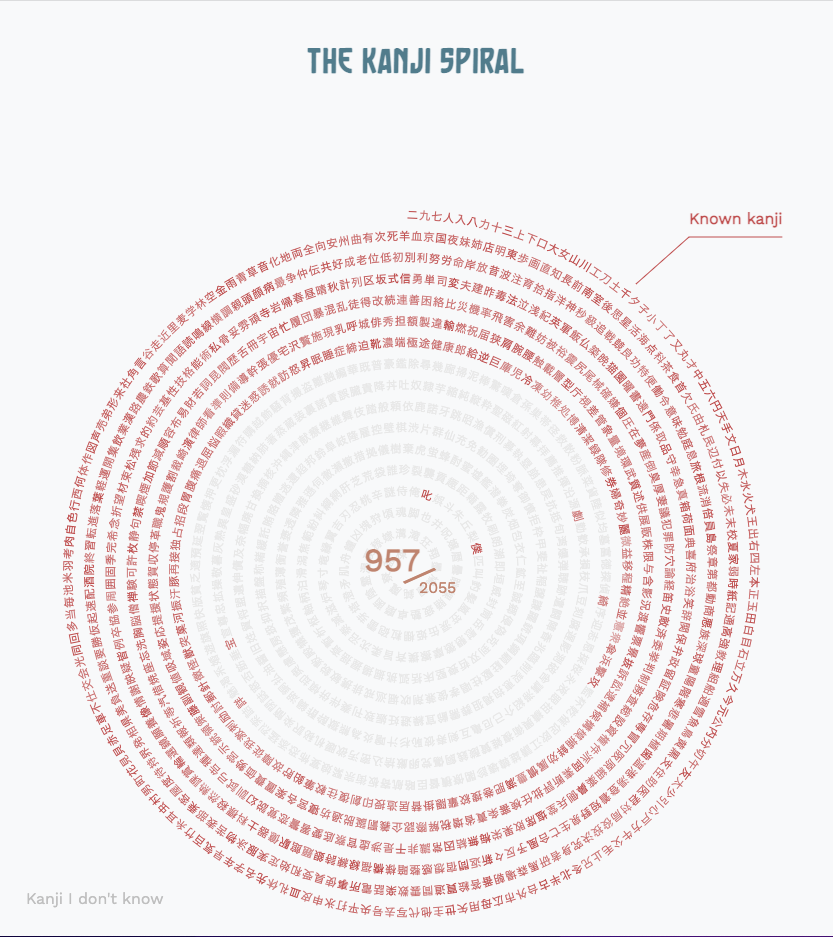
I am Max! I do too many things because of my insatiable curiosity and drive to try everything…at least once. I deleted the hobbies/interests list because its length became ridiculous. Let’s just say I have about 15+ “longevity” hobbies that I rotate between depending on my environment and its accessibility, but no matter where my travels take me, I am always fermenting and studying Japanese.
How did you get started in dataviz?
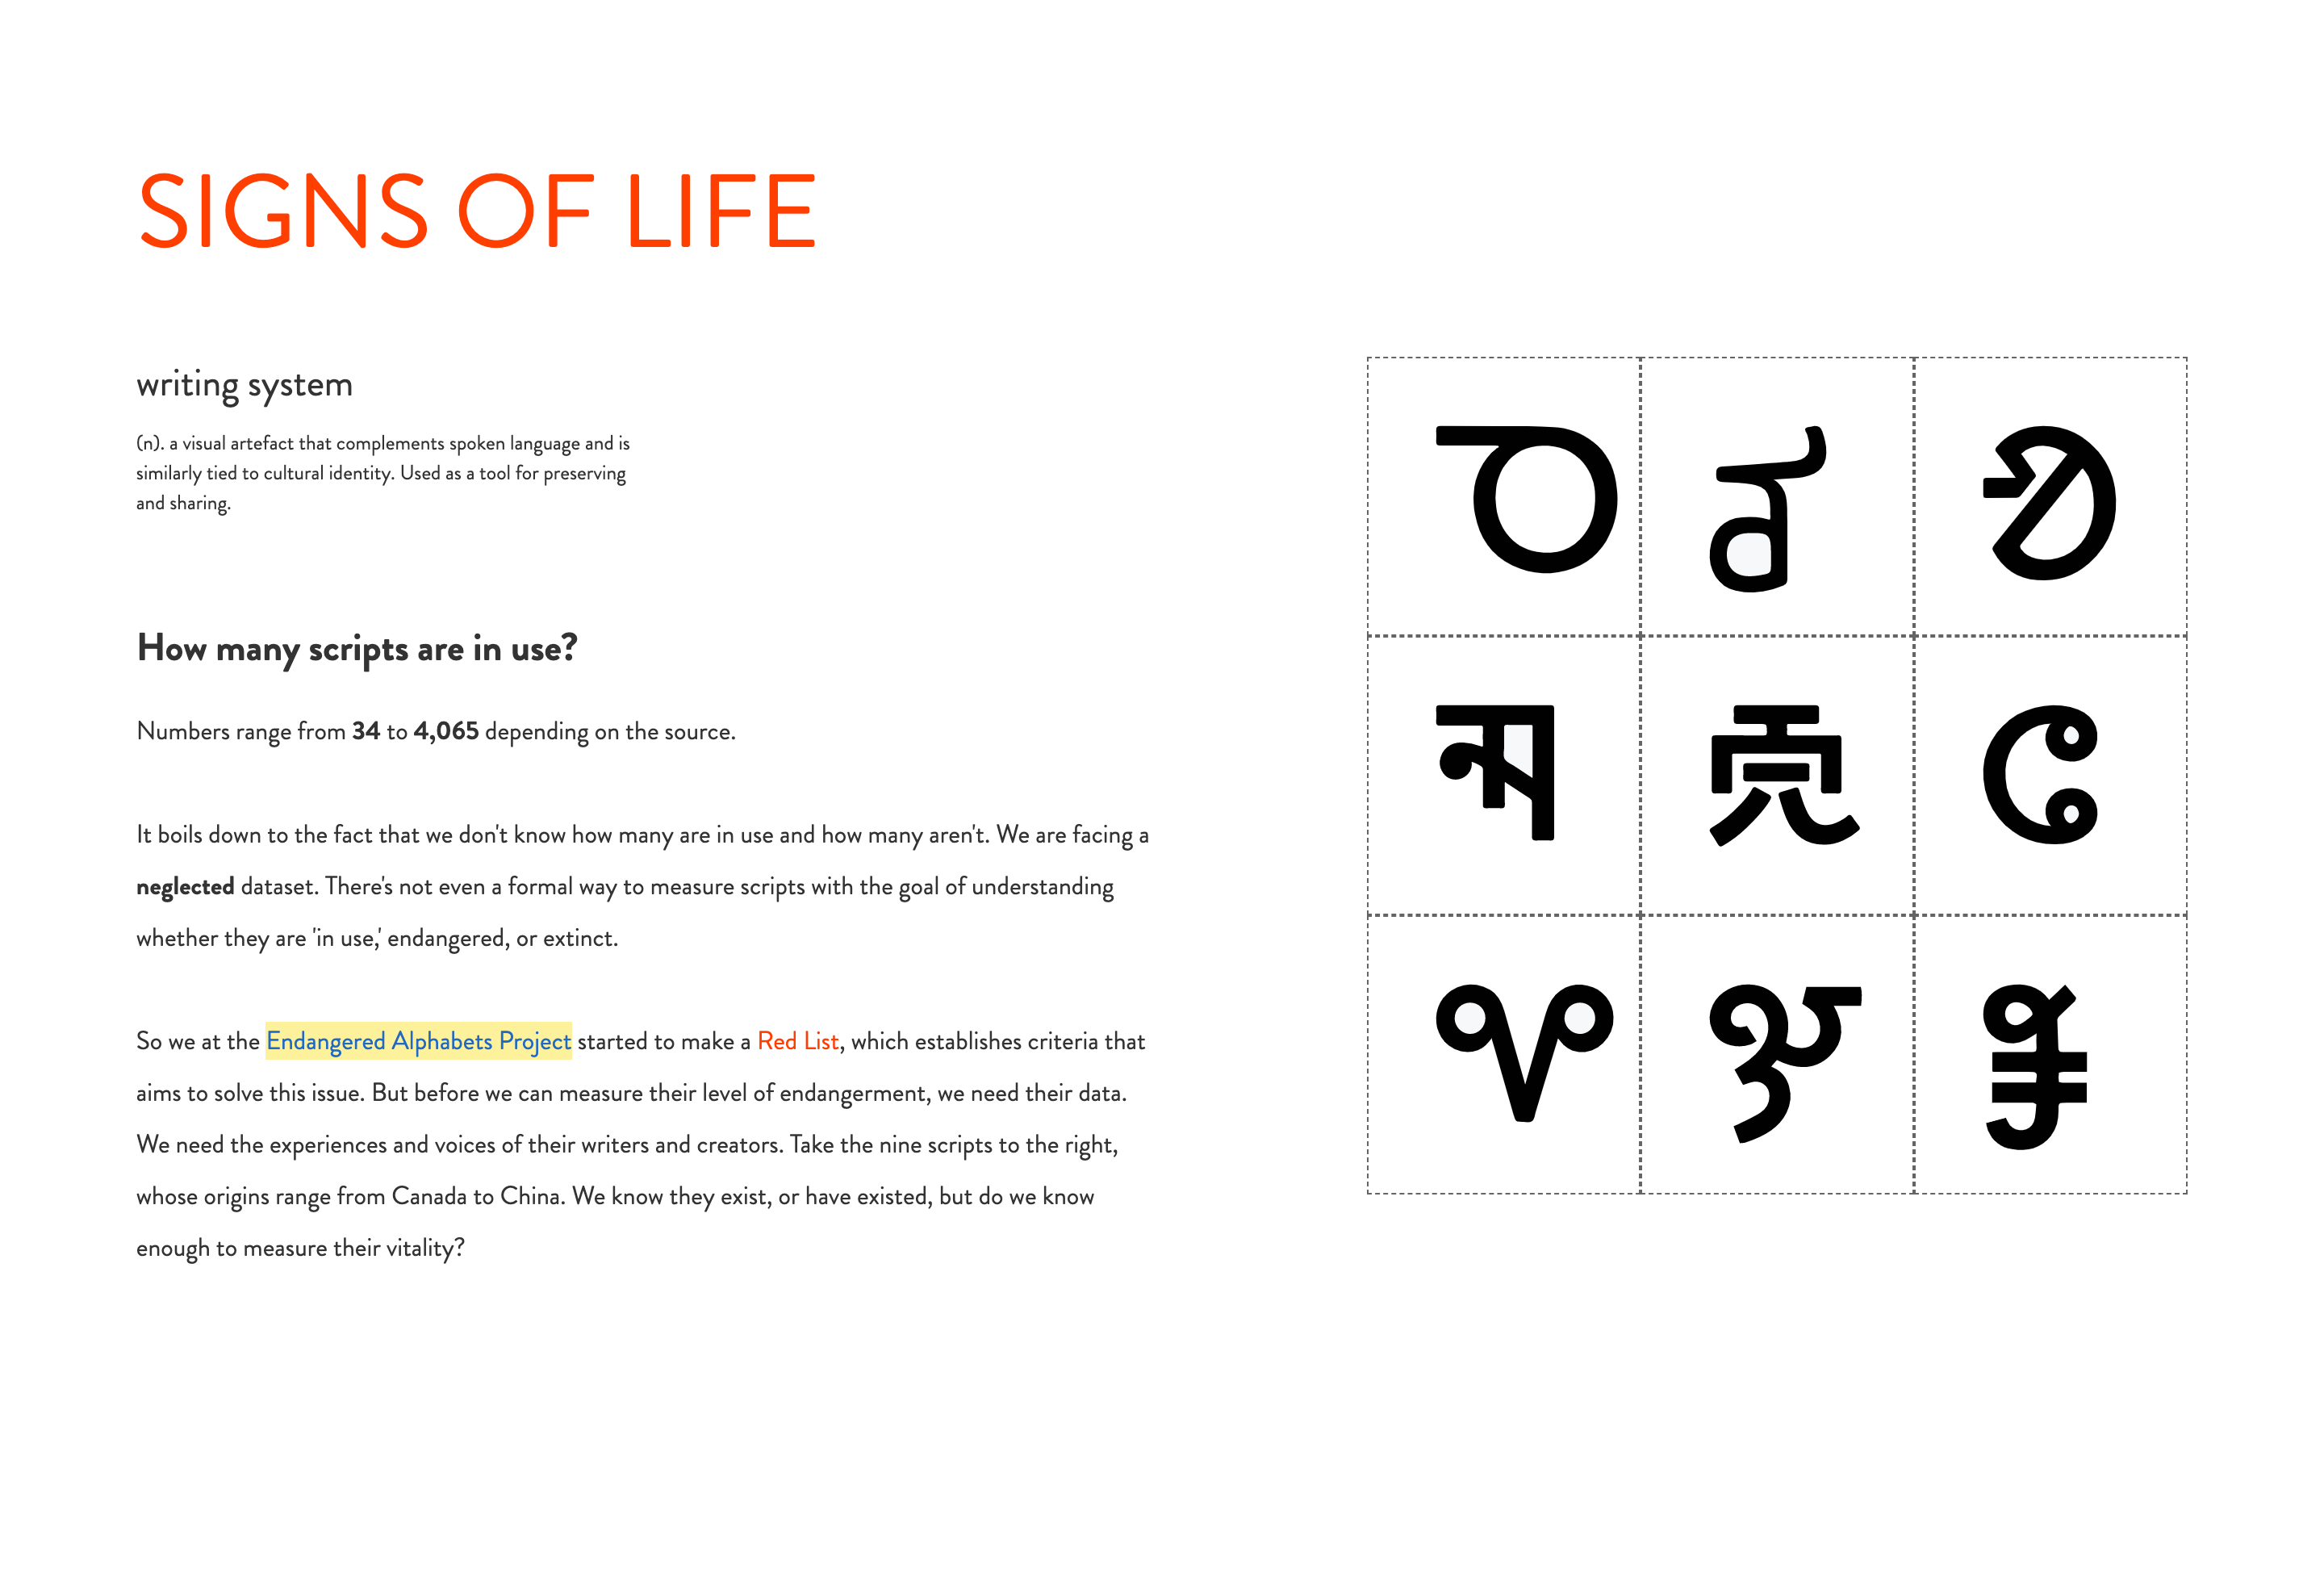
It’s actually my best meet-cute. It all started during the first year of my master’s when I was studying language typology and the documentation of endangered languages in Grenoble, France (a city surrounded by mountains). I took a class called ‘Linguistic Cartography,’ where we had the luxury of pouring over 200-year-old French dialect maps that each took up an entire dining room table. Who wouldn’t fall in love with data visualization with this kind of introduction!? But I didn’t know it was actually a career until later (I had to face reality - linguistic cartography was not a promising career) when I was going down a rabbit hole, following a UI design course that had a 20-minute video on UI and data visualization. The obsession began. After years of collecting data and digesting cryptic academic data visualizations, I knew I had found ‘it.’ I was especially relieved I wouldn’t have to choose one of my passions to pursue - all can be pursued and explored through data.
Is there certain type of data visualizations that bring you joy?
Hands-down interactive visualizations, especially those that relate your experiences to the data, along with multi-sensory data visualization experiences, and beautiful scrollytelling with mixed-media (helps when it’s already about a topic I love). That, and illustrative scientific infographics (I fell in love with these as a kid). Ok, so there are many :) Maybe I can summarize it with anything that is illustrative, and designed with a lot of care and passion for the subject.
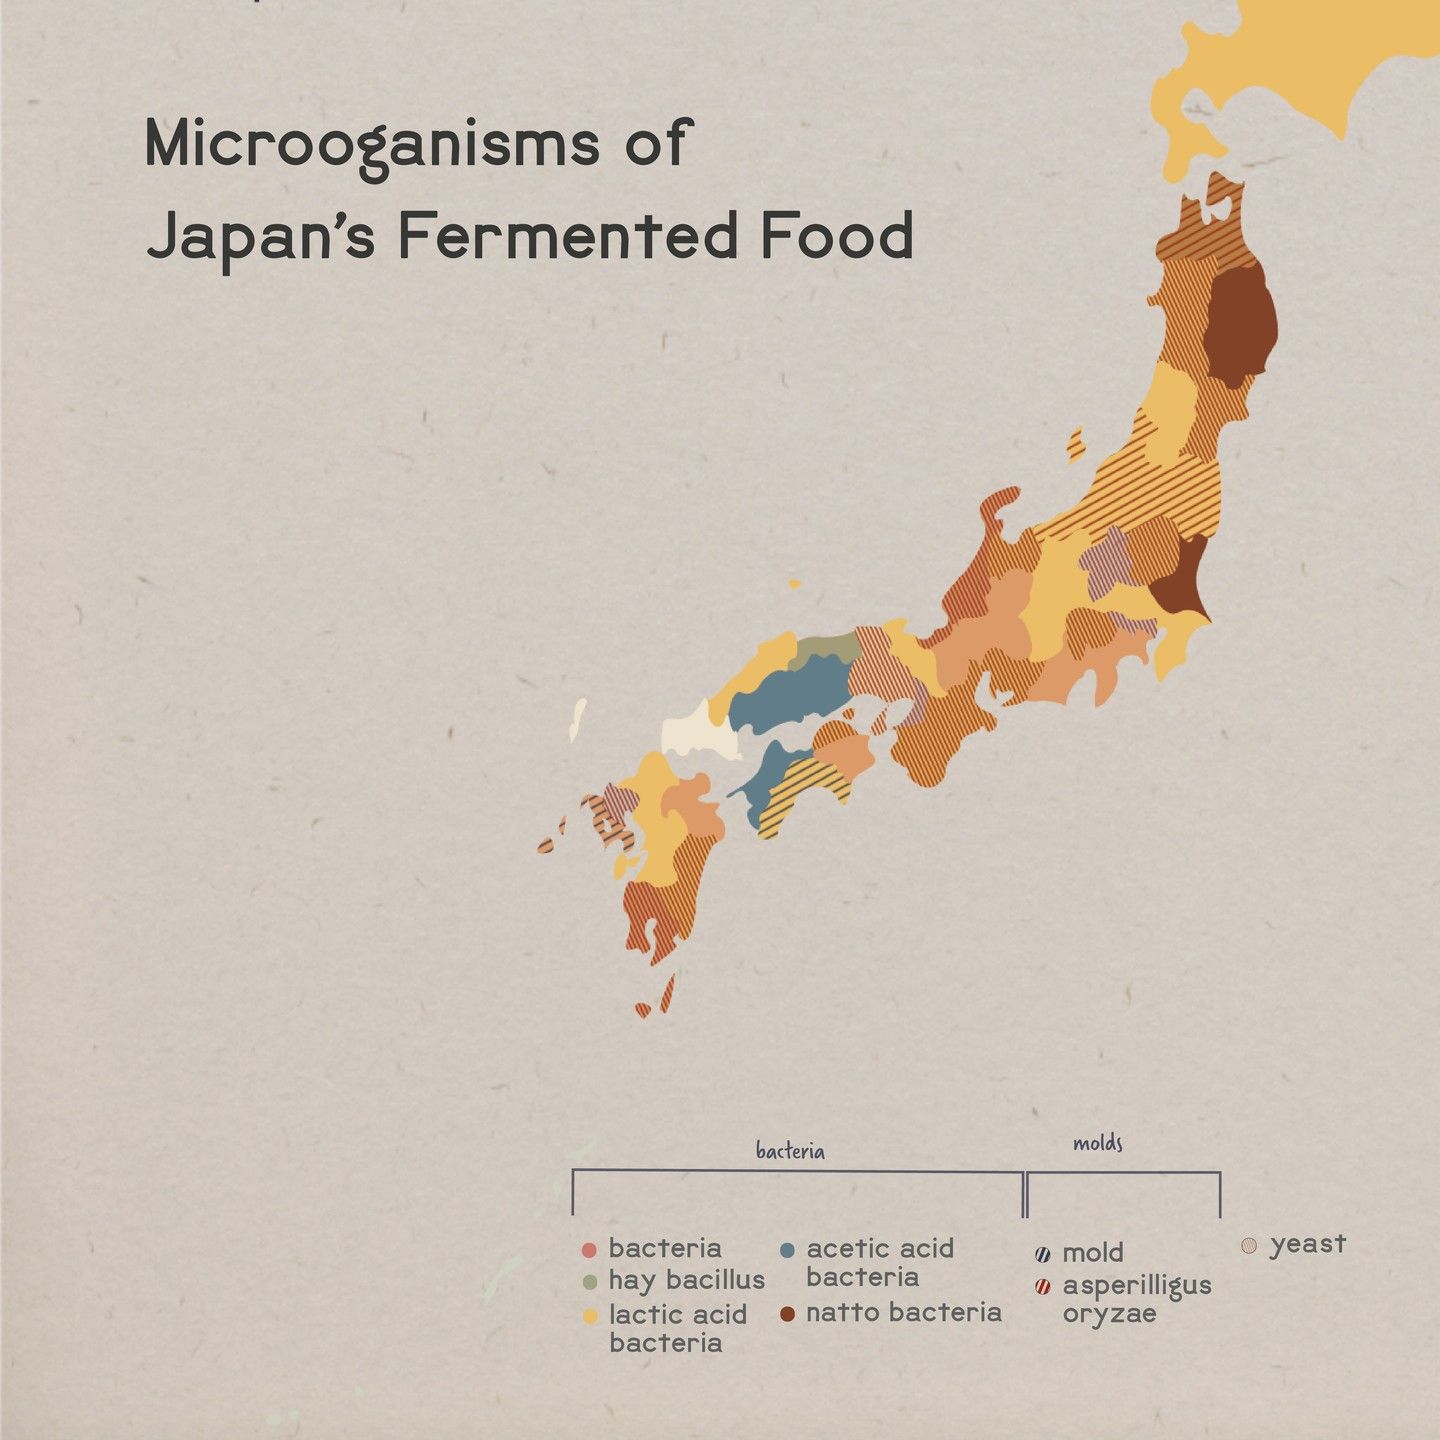
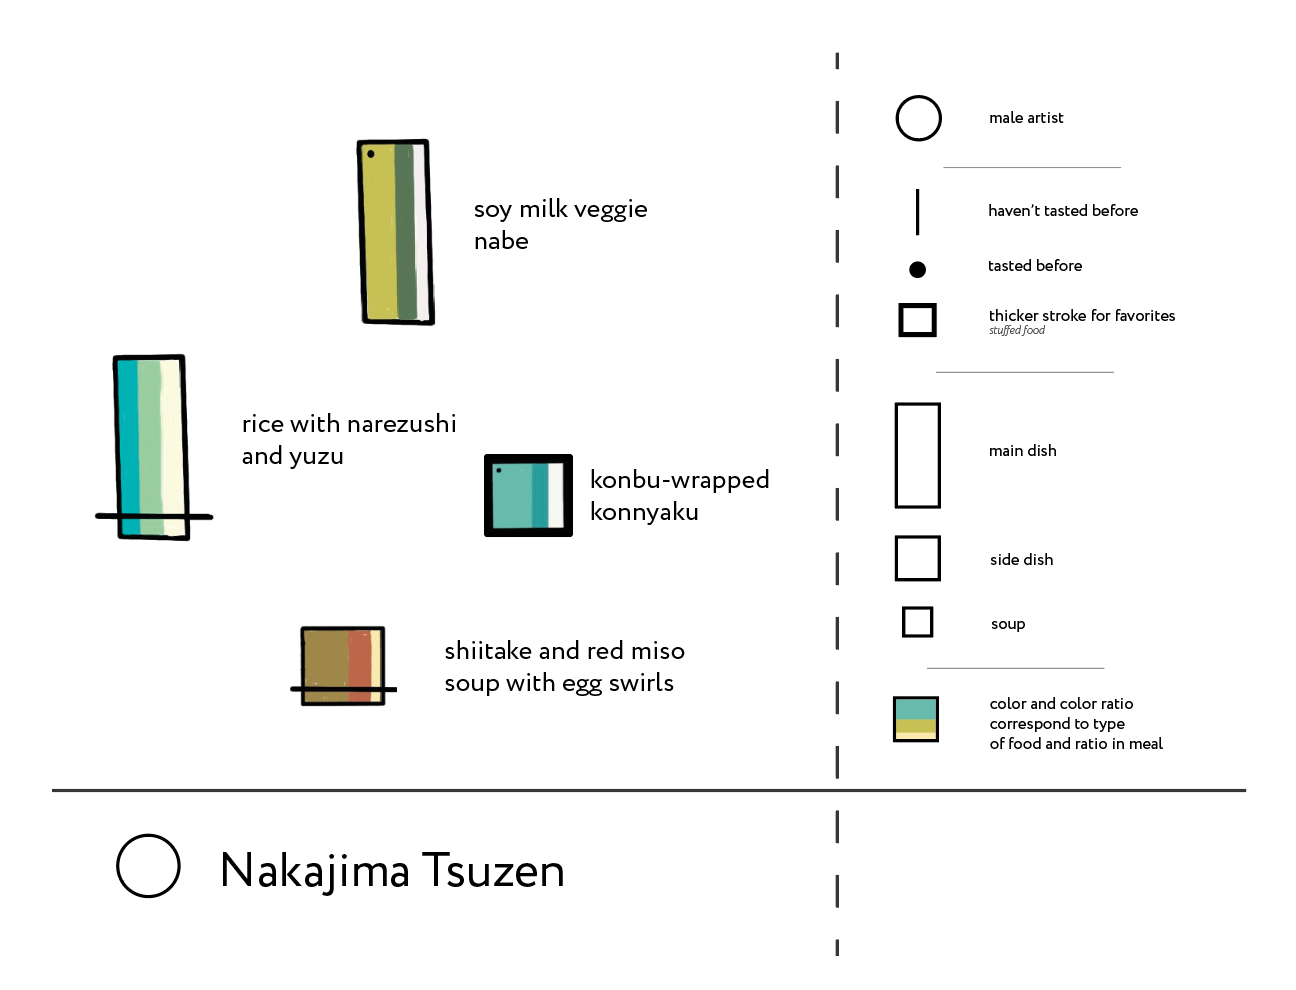
You’ve recently shared a visual on microorganisms of Japan’s fermented food, using your new personal style, what other new projects are you currently working on?
I’m still pursuing fermentation/microorganisms in a new project that I am pretty excited about. Other than that, I’m working on a fun (and slow-moving) project with a friend that has to do with translating IMU data (time-series data that reflects orientation and acceleration with x, y, z) into sound & a drawing on a little raspberry pi screen. I’ll share more when (if) we finish. I’m also working on little projects to keep learning about design and sonification.
What are your biggest challenges when it comes to the world of data visualization?
Globally, the fact that there are so many good data visualizations that don’t get their time to shine, and that saddens me. Personally, finding focus.
We loved your presentation at Outlier and Newsletter dedicated to multi-sensorial dataviz. How do you see this type of data project, using senses over vision, applied in the future?
The main issue I find is that you can’t have a ‘sit-back’ online experience of smell, taste, and touch. You can only give the audience prompts, and leave it up to them to follow (and most won’t). All the senses are intertwined, and we are more “synesthete” than we think, so we can play with sound & sight’s relationship to smell and taste in a virtual environment. A dream that I’ve had for some time now would be to help design interactive exhibitions for museums. For now, I’m trying to level up skills that I hope will get me there, and thinking of ways I can harness VR to bring more of a virtual impact to data visualizations.
You’ve been one of our most active members these past months, do you have a recommendation for others on how to take advantage of Elevate?
Mostly to not be afraid to post their work and ask questions. Critiquing others' work is not just a great way to build relationships and trust with others, but also it helps reflect into your own projects and processes. So you shouldn’t be afraid to post your work or questions as it will benefit us all!
More about Max
You can check out her website with all her projects or follow her on Twitter and Instagram. Thank you, Max!✨